How to check if Google Analytics (or any analytics tool) is working correctly?

Whether you’ve recently added a new tracking snippet to your site or have reasons to believe that your website analytics might not be functioning properly, it’s a good idea to verify if your analytics setup is correctly installed.
Doing this can help eliminate ambiguity and ensure a strong base for analyzing site traffic, understanding user behaviors, and drawing meaningful conclusions.
In this post, we discuss everything that you can possibly do to ensure that your web analytics setup is working just fine! If you’re using Plausible, jump to the section about troubleshooting a Plausible script.
- Step-by-step guide to check if your analytics tool is installed and tracking correctly
- Ensuring Plausible Analytics is installed correctly
- Ensuring Google Analytics 4 is installed correctly
- A tip to ensure a good analytics setup
Step-by-step guide to check if your analytics tool is installed and tracking correctly
Web analytics tracking codes are typically JavaScript snippets. When installed on web pages, they serve as the medium for collecting data from visitor interactions on one hand and reporting them to the UI on the other.
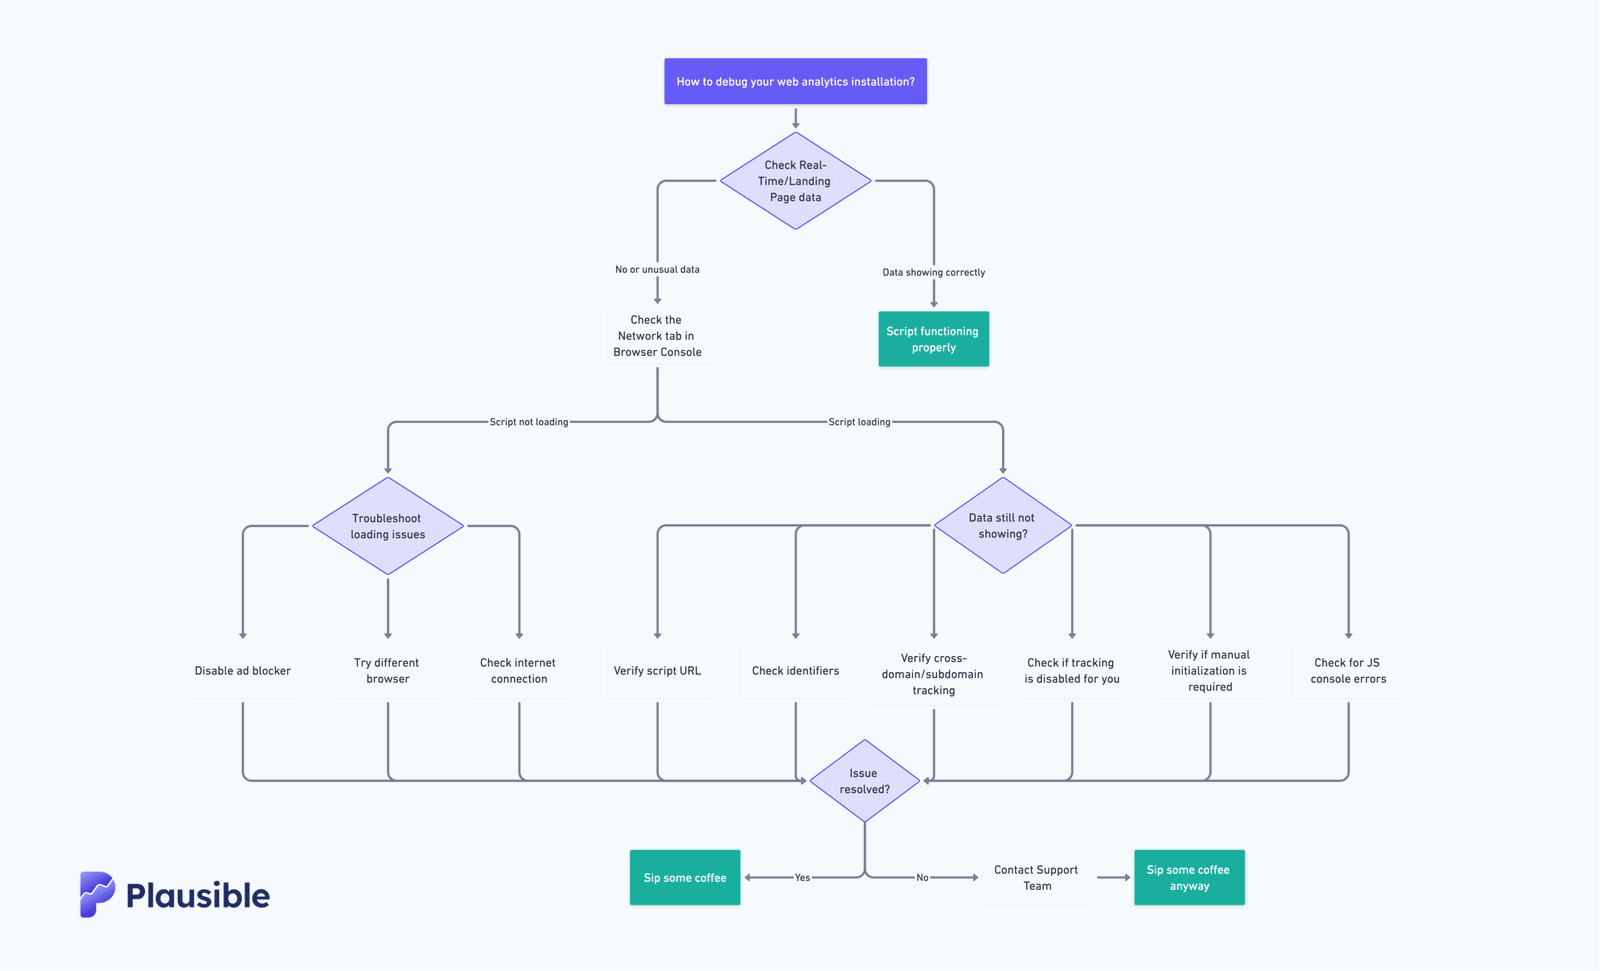
This is a general guide for checking for possible analytics installation issues that can be applied to most web analytic tracking tools.
If you are comparing two analytics tools and expecting to see exact same numbers and that is the reason you’re investigating if your analytics is working properly, it also might be worth checking out this guide on “Why analytics tools never show the same numbers?”

Start by checking your Real Time and/or Landing Pages data
The best way to quickly verify that your analytics script is working is to check the real-time data. If the data is showing up correctly, it means your script is functioning properly. If your analytic tool does not have Real Time reports, wait for a few minutes to see if data shows up in standard reports.
Alternatively, see if you can spot some landing pages getting no or unusually little traffic. One possible cause of this could be that your website developer missed adding the tracking script to a few web pages, or you’re running analytics for a Single Page Application (SPA) with a broken installation.
To prevent this, make sure the script is added to the source code of every page on your site. If you’re using an official plugin, like Plausible for WordPress, it can help ensure the script is properly included everywhere by default.
If this is not it, move over to the Browser Console as explained below.
Check your browser’s Network tab
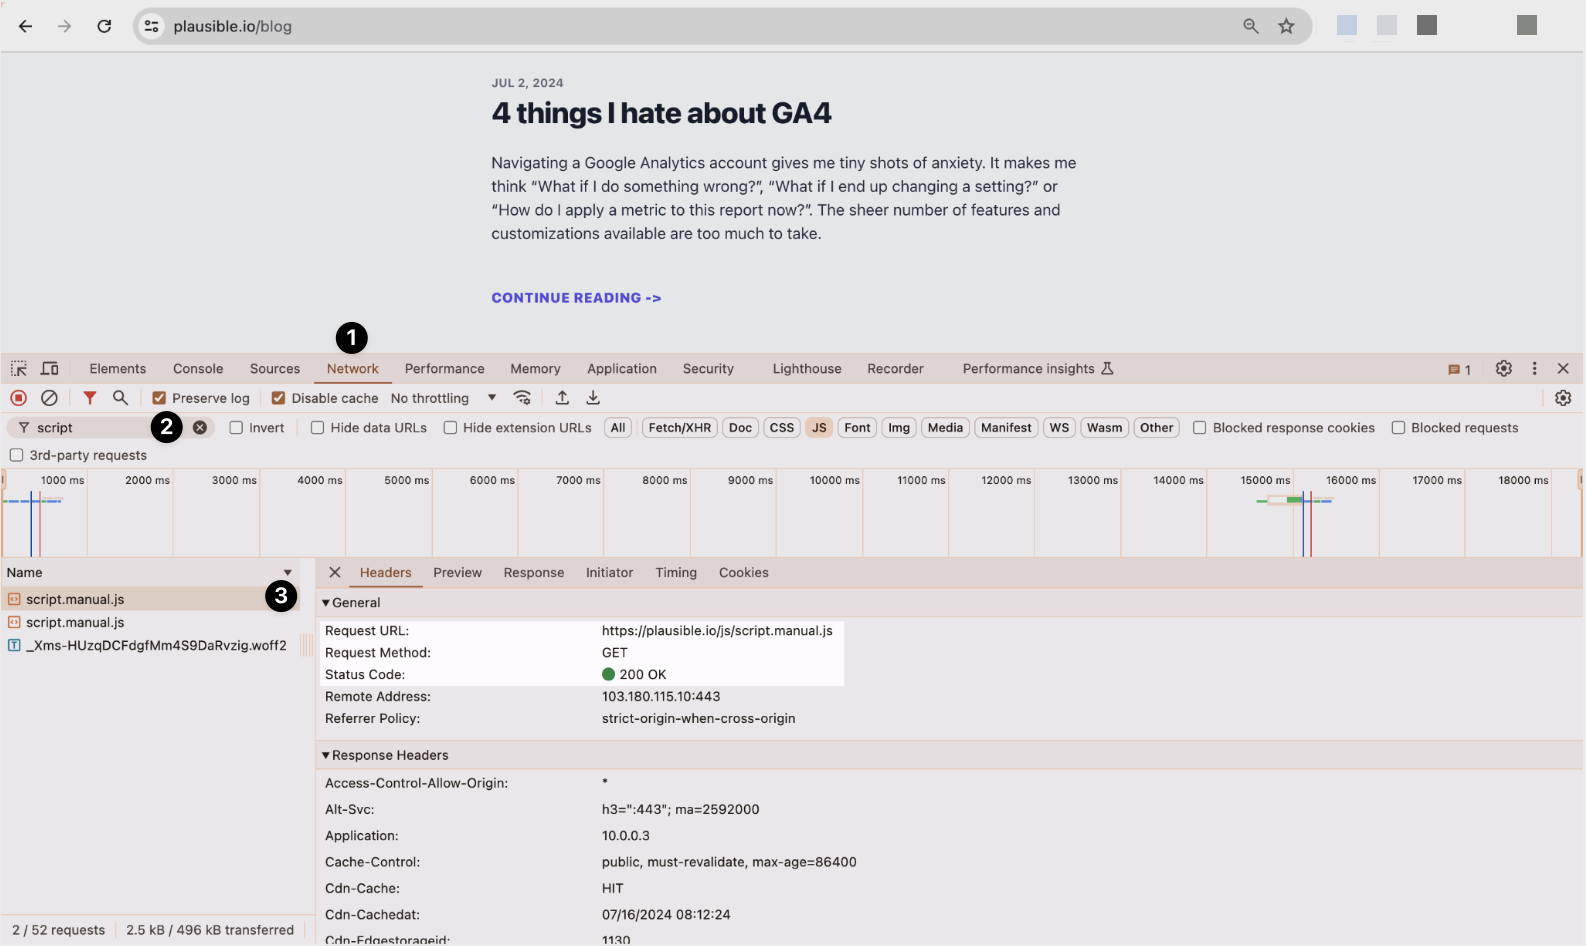
This is where you can get the full picture of whether your tracking code is working properly or not. Start by opening a web page, right-click anywhere, and go to “Inspect” -> “Network” tab. Use the search bar to search for your script’s file by trying keywords like “script”, “plausible”, “analytics”, or similar.
Locate the file and check if it is loading. For example, If I do this activity for Plausible’s blog page, then this is what I should see:

The green dot with “200 OK” here indicates that the tracking script is loading fine on this webpage. For some scripts, this number might not always be 200. As long as it’s in the 200-299 range, the loading is successful.
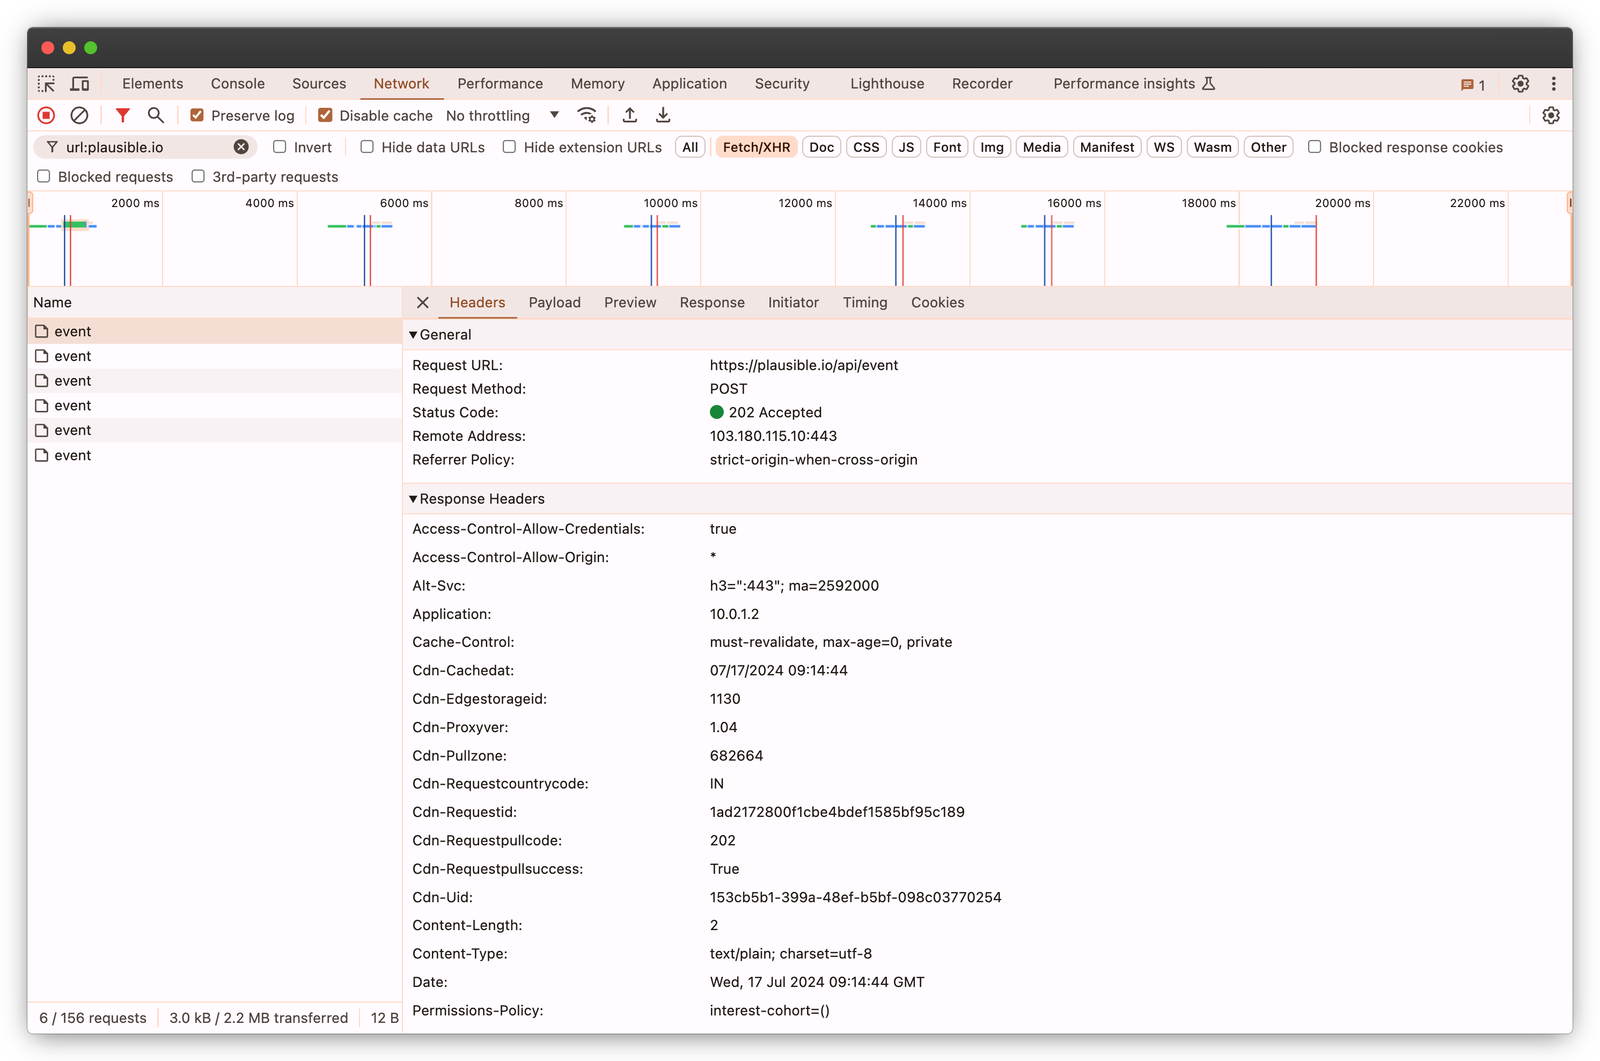
Tip: If you are doing this activity for checking the collection of specific events, or want to access every script loaded by Plausible, then try searching for “url:plausible.io”.
Note: In case your website admin has added the analytics script via an NPM package directly in the source code, the network tab may not show the script being downloaded, however the tracking events will still show up as you interact with the website.
What to do if the analytics script doesn’t load…
If you found out that the script is not loading, then check these things:
- Check if you have an ad blocker installed. Disable the ad blocker for this web page, and reload it to check if the script starts loading. Alternatively, you can allow your analytics domain within your ad blocker’s settings. Some analytics tools allow you to serve the script from your own domain. Here’s how you can do it for Plausible.
- Check with a different browser. Some browsers like Safari are stricter with privacy, and may be blocking your tracker by default. Try troubleshooting on a different browser.
- Check your internet. If you are on a company network while testing, that may be blocking the script from loading. Or your Internet Service Provider could be blocking it, in which case try switching to a different network or to your mobile hotspot.
When the script loads but no data appears…
If this is the case, then check for these things:
- Check if the script URL is correct. A script URL is the address of a JavaScript file included on a webpage. For eg. Plausible’s default script mentions the script URL as “src=…” Like this:
<script defer data-domain="yourdomain.com" src="https://plausible.io/js/script.js"></script> - Check if the identifiers are correctly added. Analytic tools assign unique tracking IDs to each website. For eg. In Plausible, we use your domain name as the unique tracking ID. See the “data-domain” mentioned in the example-script above. Similarly, Google Analytics’ identifiers take the structure of “G-XXXXXXX.”
- Check for cross-domain or subdomain tracking. Multiple tools like Plausible allow for both cross-domain and subdomain tracking. For example, you can have your website on acme.com and a learning site at learn.com (a different domain) or learn.acme.com (a subdomain). Generally, subdomains are included by default. You can check your analytics app settings to ensure that traffic from all valid hostnames are allowed.
- Check if tracking is disabled for you. Some analytic tools allow ignoring internal traffic by either setting cookies on your browser or blocking IP addresses. Run your tests in the Incognito tab or simply check your analytic tool’s settings to confirm if this is the reason your own visits are not counted.
- Check if the script needs to be manually initialized after loading. Some tracking codes (although not common with web analytic tracking tools) need to be manually initialized after loading to start collecting visitor data and sending it to analytic tool’s servers. Check your tool’s documentation to see if the script needs to be manually initialized and follow the necessary steps.
- Check for errors in the JS console. If you see an error in your JS console, then you need to contact either your dev team or your web analytic tool’s support team. A JS Console error looks similar to the following screenshot, although not exact.

Contact the Support team
If you haven’t found a solution, do contact the respective support team. :)
Ensuring Plausible Analytics is installed correctly
Once you have added the Plausible tracking snippet to your site and have had some traffic, you should ideally start seeing some numbers on a normally functioning dashboard such as ours.
If your site hasn’t had traffic yet, you may see a blinking green dot indicating that the Plausible tracking code is listening for any incoming traffic.
Plausible’s automatic script-testing tool
While Plausible listens for incoming traffic, it automatically launches a testing tool to verify if the script is able to correctly track traffic and record it in the dashboard. This works by sending some test traffic to your site.
Don’t worry, such test traffic won’t be falsely displayed as your actual traffic to the site. Instead, you will only see a success message indicating that everything is working fine. If you see this message, you can relax.
Your visits are still not recorded…
If you are confused as to why your own visits are still not getting counted by our script, do try the solutions explained in the section above. In addition to them, you can note the following:
- If you use browser extensions such as ad blockers, it can sometimes stop our script from loading. We are typically not blocked by a majority of ad blockers since we are a privacy-friendly analytics tool. But if you think this is happening anyway, then add our script to the allow-list.
- If you installed Plausible through our WordPress plugin, then all logged-in admin visits will be blocked by default.
Other issues
If you still don’t have a normally functioning dashboard, there can be many other reasons that can be easily resolved. We have put together a comprehensive troubleshooting guide to help with the same. Do contact our support team if this doesn’t resolve your issues.
Ensuring Google Analytics 4 is installed correctly
To ensure Google Analytics is installed correctly, you can check your Real Time reports. If you are instead confused about data discrepancies in your standard reports, it could be happening due to the 24-48 hours waiting period.
If you installed Google Analytics 4 using Google Tag Manager, use the “Preview” option in Google Tag Manager to understand which all pages or events your tag is firing.
You can also install the “Tag Assistant” Chrome extension to do the same process. Plus: to ensure that the data is also flowing correctly to GA4, use the DebugView.
If you installed Google Analytics 4 using gtag.js, you can install the “GA debugger” Chrome extension and use it to test the website where gtag is installed. Again, you’ll need to check GA4’s DebugView in addition to this as well.
If these processes don’t help, then check your site’s Network tab and follow the process outlined in the sections above.
A tip to ensure a good analytics setup
Implement your tracking setup in batches. If you have a robust measurement plan with a lot of events to track and are just starting to set up a new analytics account, then do not install everything in one go.
Start by implementing the foundational events, this will reduce the amount of noise in the data, and will help you ensure that the tracking is working as expected. You can then test them for a couple of days, and continue the exercise with other events as well.