Building Plausible: July 2020 recap

This last month I’ve been able to get into a nice groove with development. We added a couple of new metrics that should help customers understand their traffic better.
- 🚀 Added visit duration metric
- 📈 More detailed referrer drilldown
- 🏛️ Launched Github Sponsor page and community forum
- 💵 MRR: $2750 (+46%) and more than 400 paying subscribers
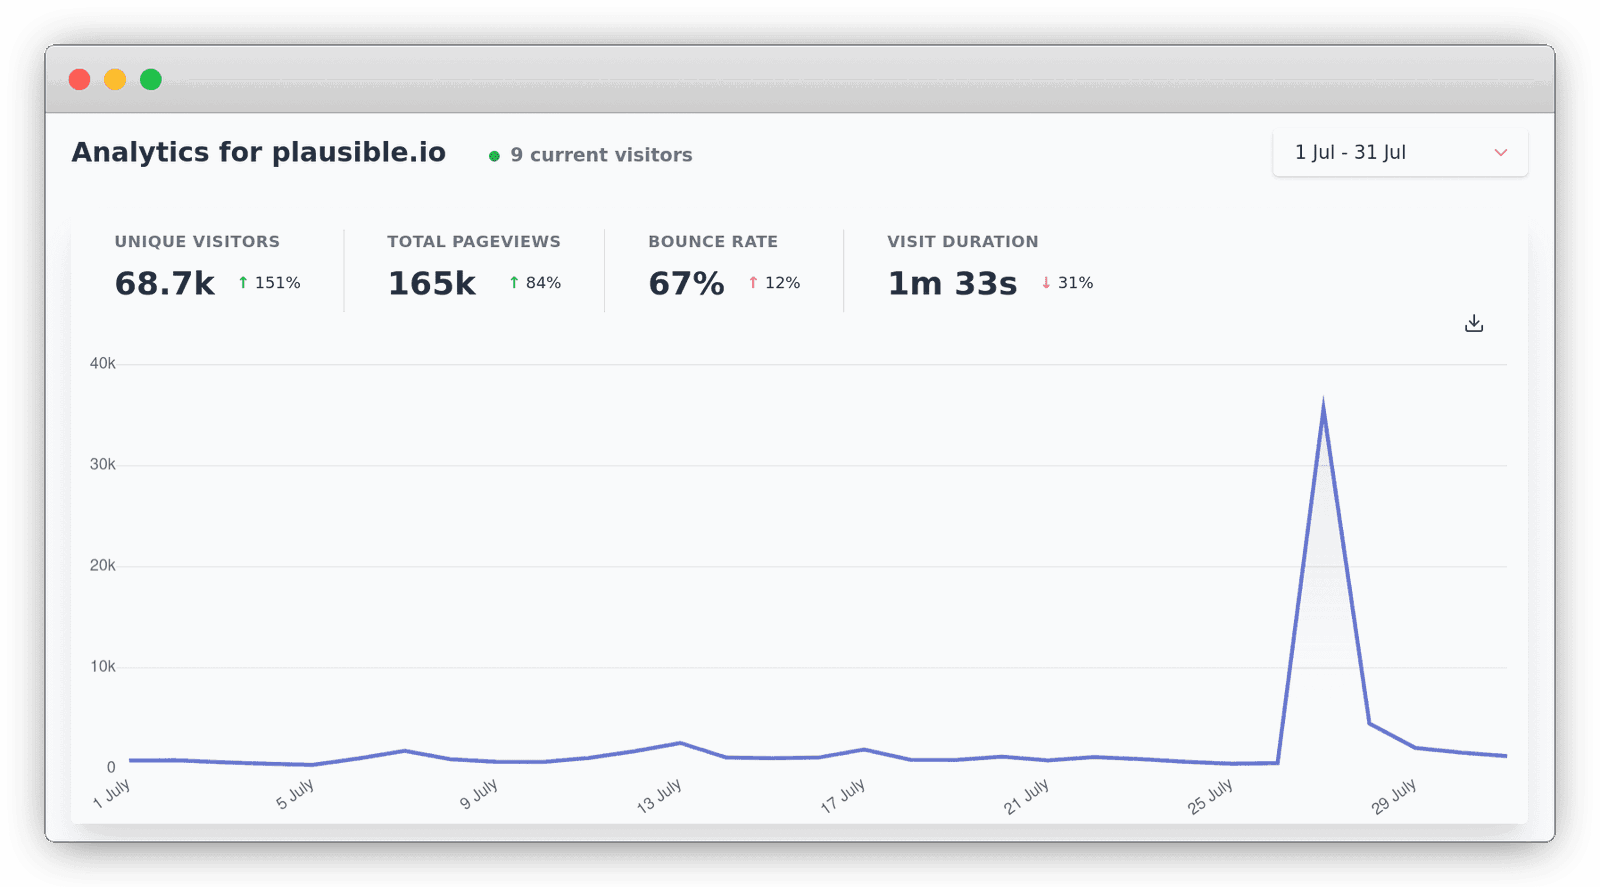
- 👩 69k visitors (+151%): Marko hit the Jackpot again and hit the front page of HackerNews with an article on How to pay your rent with your open source project. See our full stats for July.
July was a month of broken records! New top months in terms of site traffic, new best day record on July 27th with 35,665 visitors, new record for trial signups and a record day with 13 new paying subscriptions on July 18th. You can follow us on Twitter or on Mastodon for daily updates and milestones.
To be completely honest, I expected our growth to slow down quite a bit after the big traffic spikes in April and May. We did have a small dip in signups in June, but in July we signed up more trial users than any previous month. 617 new trial signups in July which is a 59% increase compared to June and it beats our previous best of 515 signups in May.
I’m also glad to see more people engage and contribute to the Github repo where we now reached 2,000 stars. We want to keep the issues tab strictly for bug reports and feature requests. For people who are struggling with the self-hosted setup or who want to discuss topics that are not strictly features or bugs, we opened a new Discourse forum.
Now, let’s take a look at the features I’ve been working on.
Visit duration

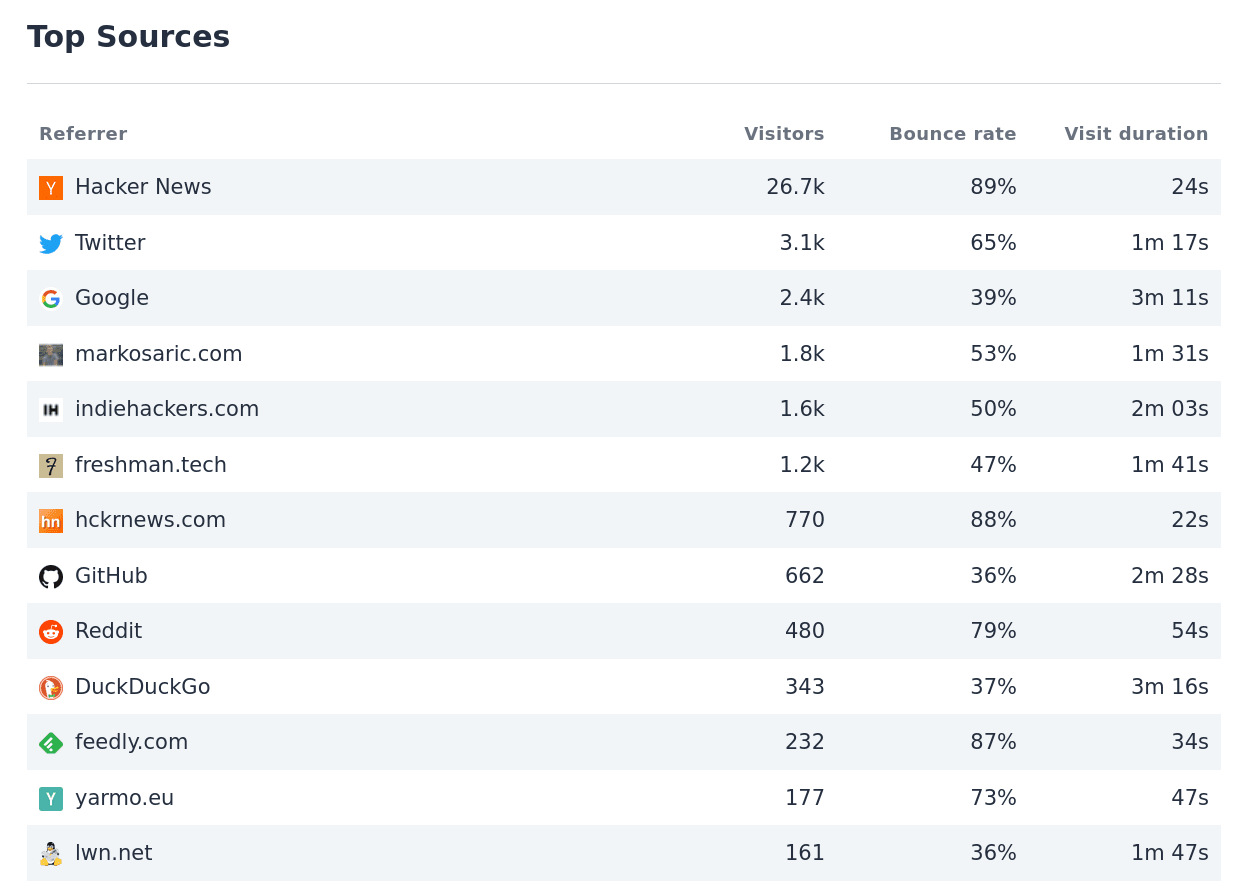
Showing average visit duration was one our most requested features. We now show overall visit duration on the top of the dashboard and it’s also broken down by source / referrer when you click ‘More’ in the traffic sources report.
I think overall visit duration isn’t all that useful if you don’t have anything to compare it with. It’s much more interesting to see visit duration broken down by referrer. Combined with bounce rate, it gives you a really good idea of the quality of traffic you get from different sources.
For our site, Reddit sends pretty bad quality traffic. 79% of visitors bounce and the average visit is only 54 seconds. Compare that with people coming from Google search: 39% bounce rate and 3m11s average duration. Clearly people who search for an analytics solution are more motivated to stay on the site.
Many analytics tools also show pageviews per session which is a similar metric to visit duration. In a call with Marko I floated the idea of rolling bounce rate, visit duration and pageviews per session into one metric called ‘engagement score’ or something like that. I think it would be interesting but I don’t want to deviate from industry standard metrics too much for now.
Referrer drilldowns
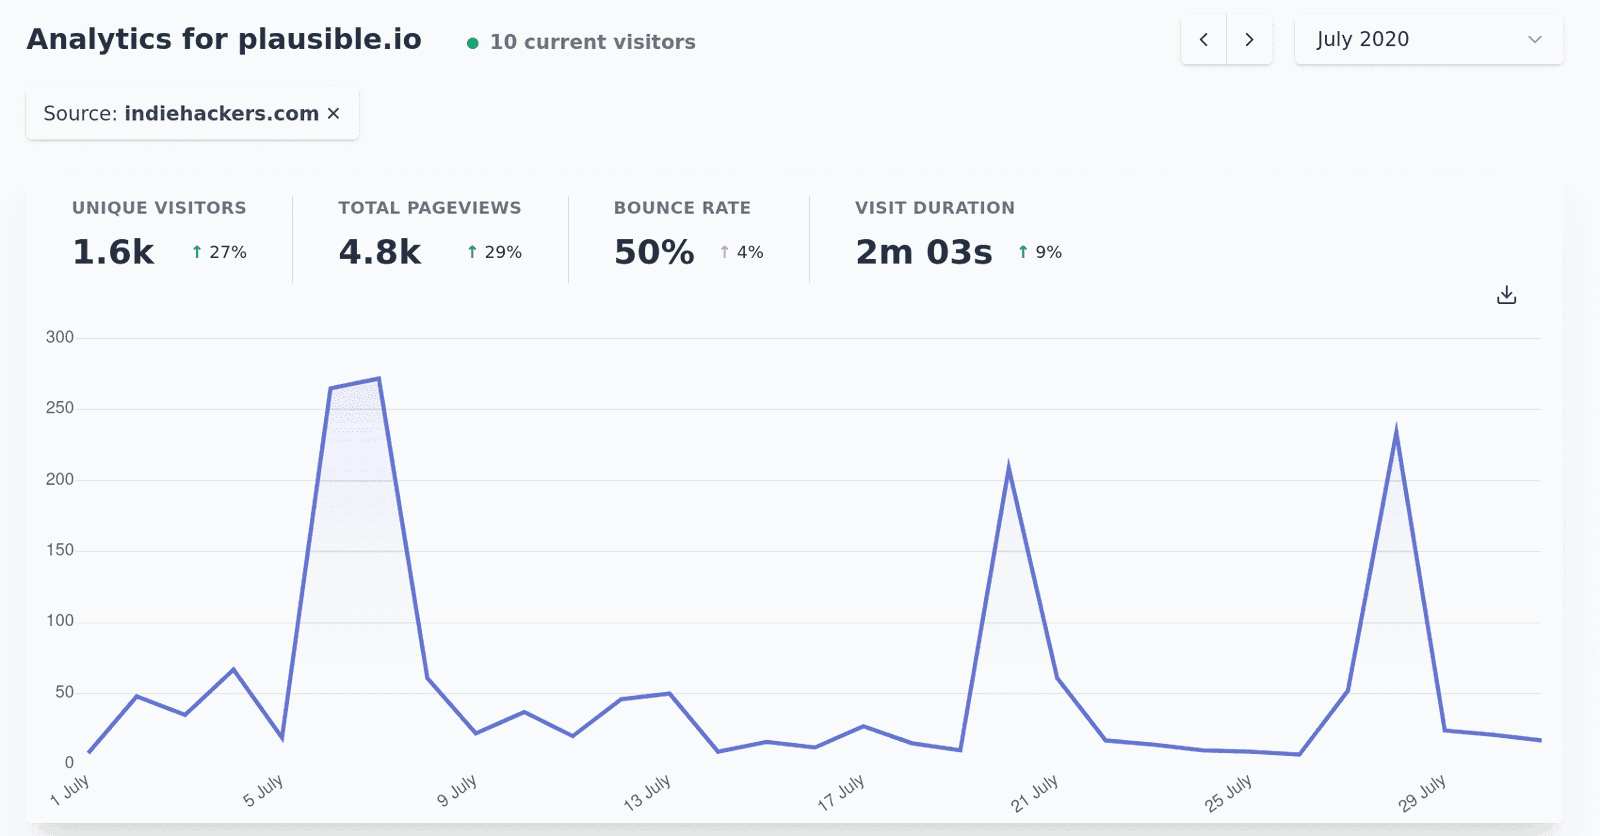
The other feature I built is more detailed referrer source drilldowns. Instead of just showing a popup with limited information, we now show the whole dashboard filtered to one traffic source. For example, click here to see traffic to our landing page from IndieHackers.

This feature is useful to see traffic from one source graphed over time. Additionally, you can find which pages people land on and even the countries and device information for a specific traffic source.
I love this feature because it adds an interesting way to slice your data without overcomplicating the interface. This is our philosophy with all future developments: keep adding depth to the dashboard without sacrificing the simplicity of the default view.
Other details from our changelog
-
We’ve added a realtime dashboard which includes data on how many people are currently on your site and what are they viewing. It also includes a pageview graph for the last 30 minutes. The whole dashboard is live so you don’t have to refresh to stay up to date.
-
Within your “Top Pages” report you can now see the number of unique visitors alongside total pageviews and bounce rate for the pages of your site.
-
We’ve removed the “Total Visitors” line from the Goal Conversions graph. It used to dwarf the goal line for most sites so now you can easier see the conversion trends.
-
We’ve made an update to the way we measure unique visitors without using cookies and without using persistent identifiers to further improve the visitor privacy. You can see the details in our data policy.
-
You can now reset your site data within the website settings area of your Plausible account. It’s useful when you’ve done some tests to make sure everything works on a new site. Then you can reset the data and start counting stats from the moment the site is public.
What’s next?
In August I’m going to take the drilldown view a bit further and also add page drilldowns. This way you can see traffic to one page over time and which sources are referring traffic to that page. This is another highly requested feature that we feel would really help us understand our own site traffic.
Beyond page drilldowns, here’s what’s on our roadmap currently:
- UX improvement to go to website settings from the dashboard
- Hash mode for SPAs
- Add metadata to custom events
- Full UTM tag support
I definitely won’t get to all of these in August, but that’s what we have coming up next.