WooCommerce analytics plugin: One-click setup for tracking sales, funnel, marketing, and more.
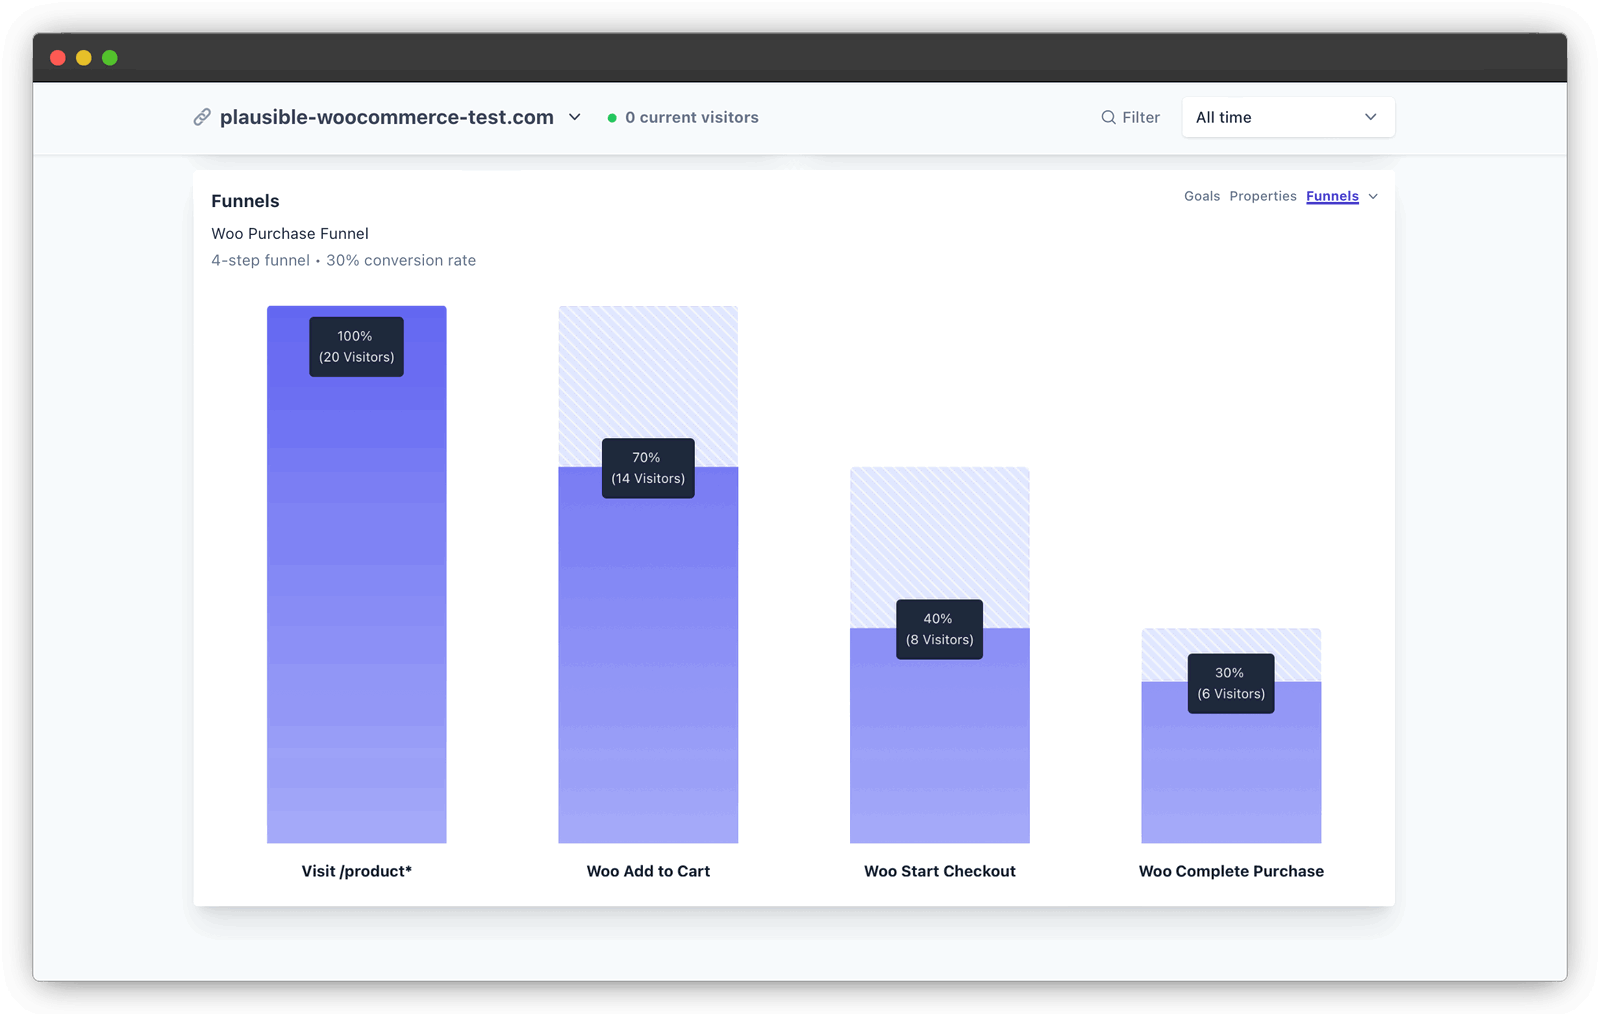
Tracking the performance of your WooCommerce store doesn’t have to be complicated. In fact, it’s incredibly straightforward with the Plausible plugin for WordPress, allowing you to set up end-to-end ecommerce site monitoring with just one click.
You will be able to track most ecommerce analytics, right on your WordPress dashboard (or Plausible dashboard, if you prefer). Analytics like:
- Which products sell the most and the least, and why?
- Which marketing channels generate the highest traffic and sales—search, social media, email, ads, or someplace else—so you can focus your efforts on the most effective ones.
- User behavior to spot where your website loses potential revenue.
- Total sales and revenue by category, over time.
- Average order value (AOV).
- Refund and return rates, cart abandonment rates and recovery opportunities.
- How many unique visitors visit the store and how much time do they spend there.
- Conversion rates such as the percentage of visitors who make a purchase, or wishlist a particular product type, or conversion rates by traffic source.
- Buyer journeys, i.e. how customers move from finding your store to checking out (funnel analysis).
- Fast-moving vs. slow-moving products.
- Where your customers are located geographically and which regions show demand for specific products.
…and more.
Such insights can help you learn better about your customer behavior, optimize your marketing and customer experience, improve product offerings, optimize the website, and maximize sales and revenue.
Or in other words, they help you get a birds-eye view of all the possible data to improve your ecommerce site’s performance.
P.S. You can take a quick look at Plausible’s live demo, where we show our own website’s real stats, to see what you’ll get in an active Plausible dashboard.
- How does Plausible Analytics compare to Google Analytics for WooCommerce tracking?
- In-built WooCommerce Analytics
- How to install the Plausible Analytics plugin for WooCommerce?
- One-click setup of ecommerce goals, properties, and purchase funnel
- Additional ecommerce site tracking with Plausible
- Answering key ecommerce questions with Plausible Analytics
- Quick recap
How does Plausible Analytics compare to Google Analytics for WooCommerce tracking?
Traditionally, Google Analytics has been the go-to tool for this purpose. But it requires a deeply technical and complex setup, loses a lot of accurate data due to being blocked by many ad blockers, missing bot protection and consent banner declines, and is not GDPR-compliant.
Plausible Analytics is a powerful alternative that is lightweight, easy to use, and privacy-friendly.
Let’s see:
Easy vs complex setup and analysis, for the same insights
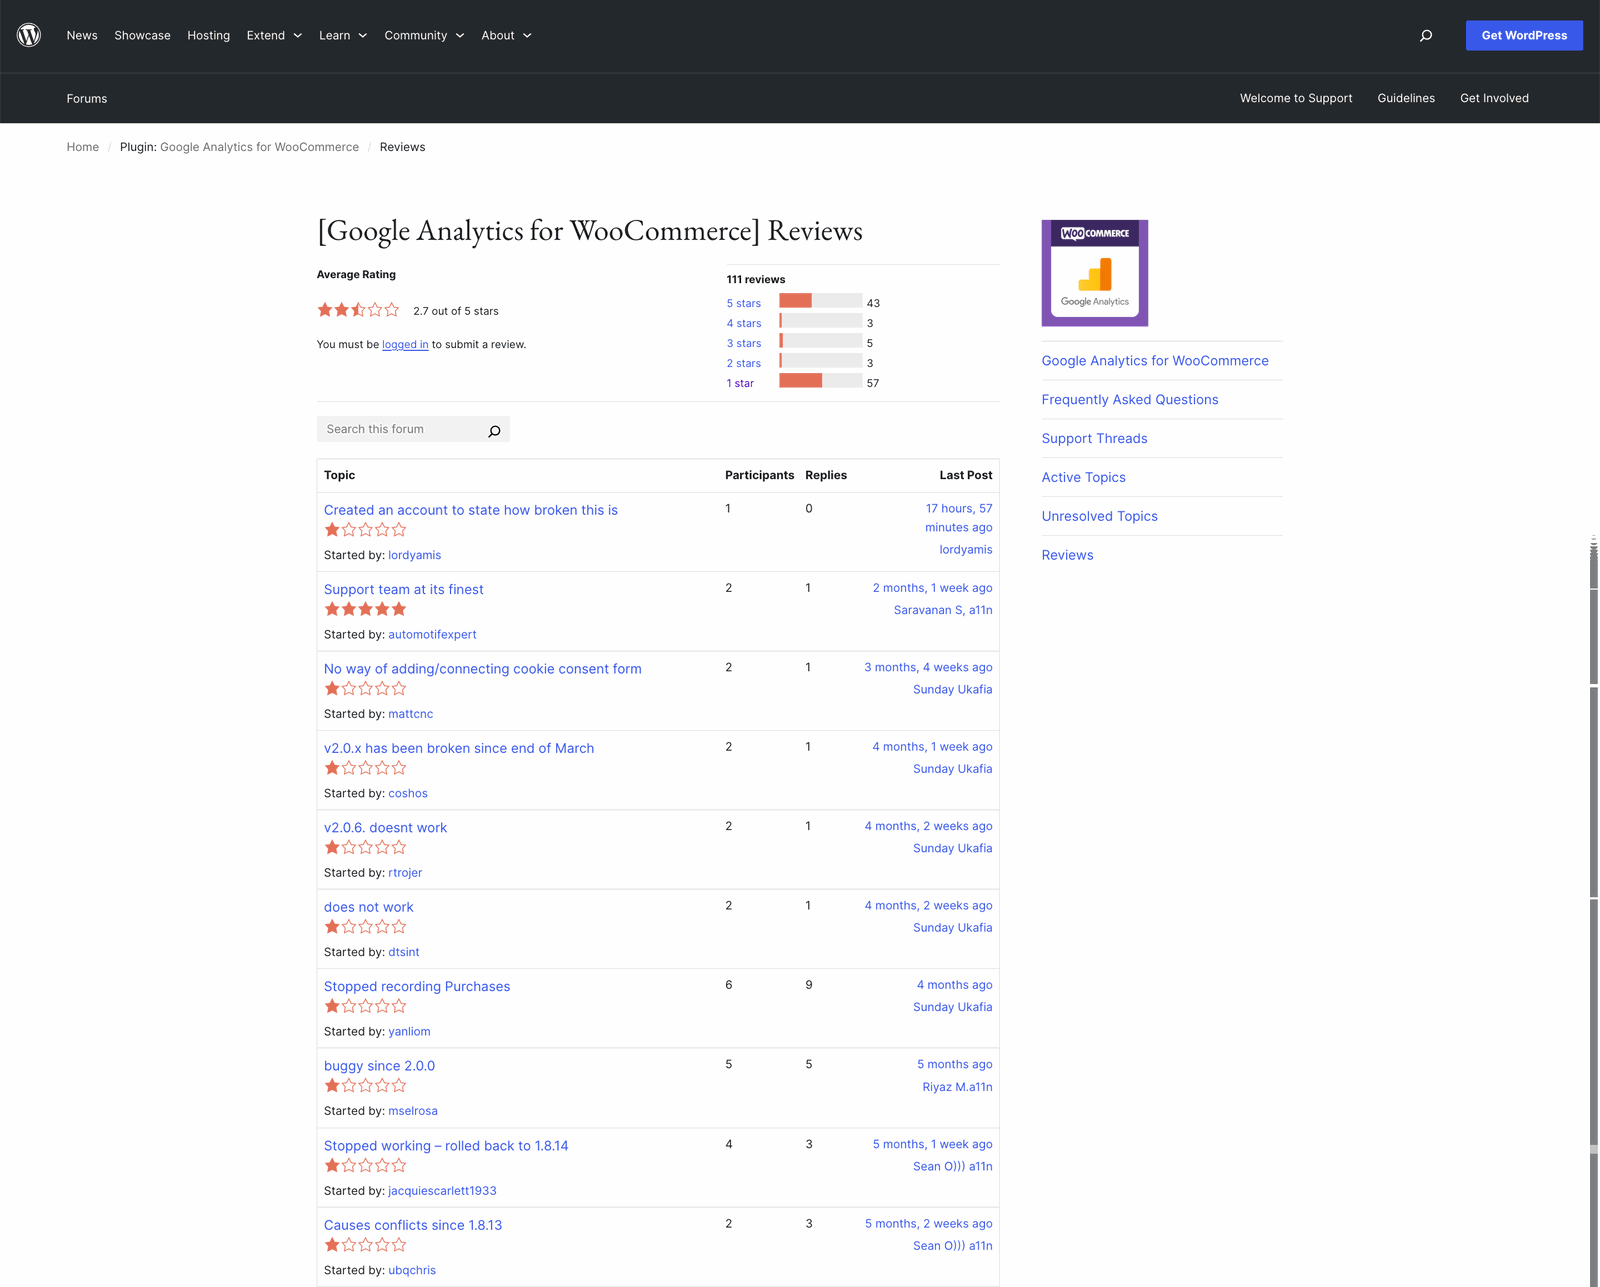
On visiting the official Google Analytics for WooCommerce plugin page, you will find many recent reviews of how the new version hasn’t been working for months, how it slows down the WooCommerce site, doesn’t even integrate well with GA4, is not compliant with GDPR, etc.
They have an average rating of 2.8 stars:
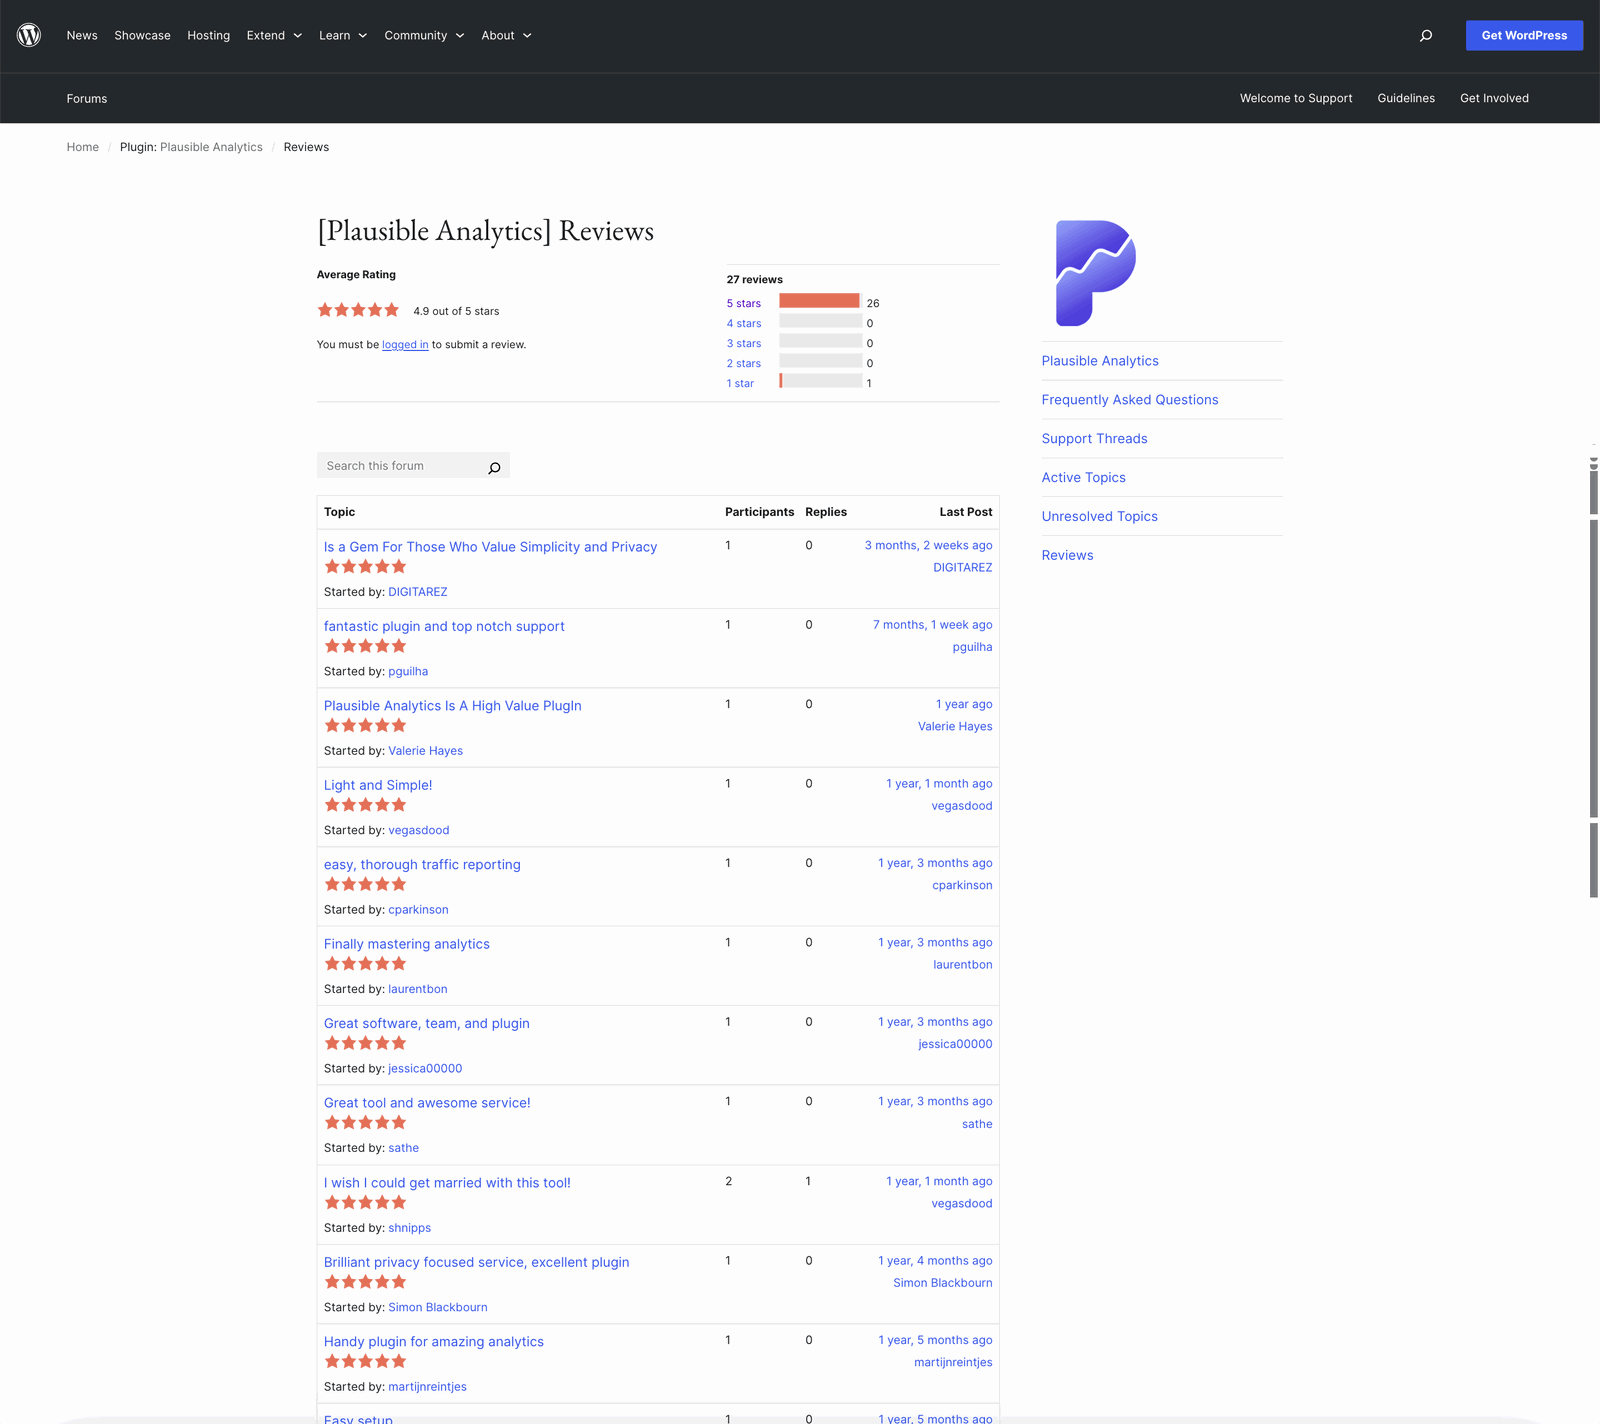
On the other hand, the official Plausible plugin page is used on more than 10k WordPress sites, with an average rating of 4.9 stars:
This means that if Google Analytics 4 is your choice, you will need to manually set everything up since its WooCommerce plugin is not reliable.
And a manual Google Analytics 4 setup for ecommerce typically involves collaborating with a developer to send necessary ecommerce events (eg: “purchase”), text and numerical parameters (eg: “currency”, “transaction-ID”, “coupon”, etc.) to the data layer in Google Tag Manager (while taking care of character limits), followed by testing everything through the DebugView, configuring events, custom dimensions, metrics, etc. in the GA4 UI, and even building your reports from scratch using the Free Form functionality. Phew.
We, at Plausible, know pretty much about web analytics and even we wouldn’t want to do all that. That, by the way, is why we built Plausible in the first place.
GA4 loses a LOT of accurate data. Plausible is built on accurate data only.
Imagine going through all the trouble of setting up Google Analytics 4 as described above and still ending up with half-accurate data. A recent independent study done by a marketing and analytics expert found that the amount of data missing from GA4, in comparison to Plausible, can be as much as 55%.
This mainly happens due to privacy-conscious individuals who decline cookie consent banners, have ad blockers in place, and use privacy-respecting browsers like Safari and Firefox –– all of which block the Google Analytics script from firing and not recording data.
Secondly, Google Analytics fails to protect your site from bot traffic. You’d need to do some manual work to exclude that in Google Analytics 4 as well. Plausible blocks ~32K known data center IP ranges (i.e. a lot of bot IP addresses) by default. We offer bot protection out-of-the-box.
GA4 is not GDPR-compliant. Plausible is built in the EU itself.
Several European DPAs have claimed that Google Analytics is not legal to use. Google Analytics tracks and stores a lot of personal data and it is a potential legal liability for your site, and a risky trust factor with your customers and other stakeholders.
This forces Google Analytics users to implement cookie banners and provide a bad site experience to their visitors. With Plausible, we don’t use cookies to track your users outside your site, and therefore have in-built compliance with regulations like GDPR, CCPA, PECR, etc.
You can ditch cookie consent banners, from our side. Please don’t take this as official legal advice, though. It is crucial to consult with your local lawyers to understand compliances that apply to you and meet them for your particular region.
GA4 will slow down your ecommerce site. Plausible will not.
The recommended GA4 implementation with Google Tag Manager uses a JavaScript file that is much heavier than that of Plausible. If you use GTag and not GTM, the difference is even bigger. We have a detailed study of this here.
Slower stores are bad for SEO, site experience, cart abandonment, and whatnot. The Plausible script is lightweight: practically incapable of slowing down any site.
In-built WooCommerce Analytics
WooCommerce account comes with some in-built reporting for tracking basic ecommerce metrics like sales, orders, refunds, taxes, shipping, etc. The main difference between this reporting and a web analytics plugin like Plausible is that you can also do the following with Plausible:
- You can also track traffic to pages, and where they come from (social, ads, emails, etc.).
- You can track the effectiveness of various marketing campaigns like an organic social media campaign, a Google Ads campaign, SEO, etc. and directly link them to sales.
- You can track other metrics like bounce rate, visit duration, pages visited on your website, devices used, users’ countries and regions, etc.
- You can visualize the end-to-end user journey from discovering your product or brand to completing a checkout. You can build purchase funnels on Plausible. With this understanding of customers’ behavior and preferences, and where the funnel is leaking, you can take corrective action to improve sales.
- You can track anything you want (like on your website through custom events, beyond the standard events provided by the in-house WooCommerce analytics.
- Plausible has an extremely simple and convenient dashboard, with none other like it in the industry. There’s the added benefit of not having to use cookie banners, and never counting bots (only real traffic).
- Get done with an otherwise technical setup in a single click, as we show below.
In short, you not only track some ecommerce business metrics, but also get a holistic view of your website’s and marketing campaigns’ performance, opening up opportunities to improve them.
How to install the Plausible Analytics plugin for WooCommerce?
You need two active accounts for a functioning store and analytics:
- An active store with WooCommerce (WordPress-based ecommerce manager),
- An active account with Plausible (we have a 30-day free trial, in case you’re yet to try it out).
To start using the Plausible plugin, visit your WordPress dashboard and open the “Plugins” section. Click on “Add New,” and search for “Plausible Analytics.”
Then, click the “Install Now” button, followed by clicking the “Activate” button. Follow the on-screen guide to finish your set up. We have more detailed instructions on this here.
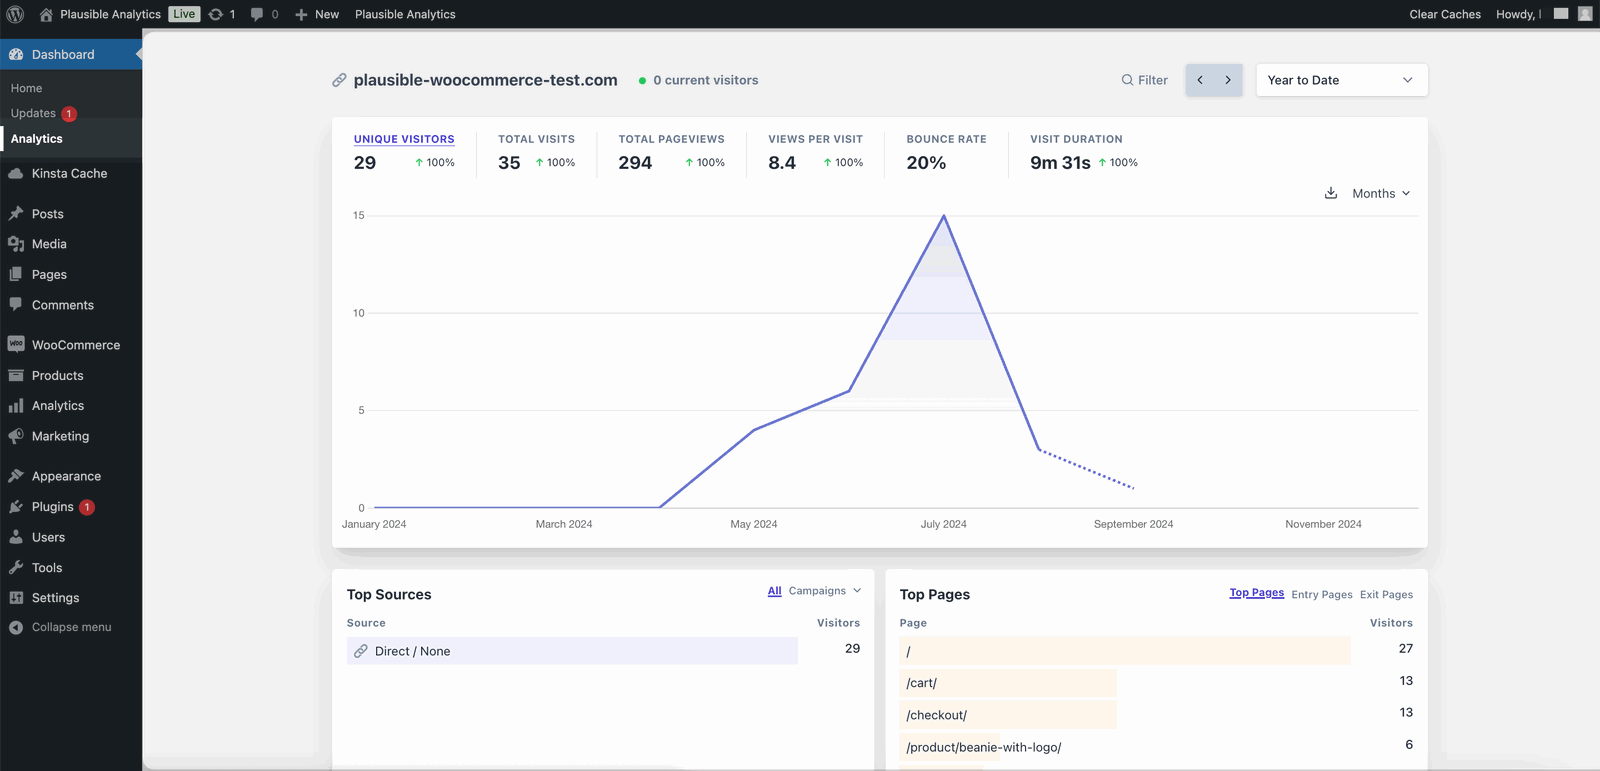
Your web analytics are now active! You’ll be able to view this both in your Plausible account and WordPress dashboard. Here’s what it looks like within WordPress:
One-click setup of ecommerce goals, properties, and purchase funnel
Coming to the most fun part. It’s time to witness magic. With a raw Plausible dashboard, you generally need to manually set up custom events, custom properties (i.e. what’s called custom dimensions in Google Analytics 4), and funnels.
This can be a lengthy task for ecommerce site owners because it involves having a clear understanding of what all should be tracked, followed by tagging those events and properties, making some code changes, and configuring a funnel.
We anticipated this requirement of ecommerce store owners and did all that by default instead! All you gotta do is turn on “Ecommerce revenue” on the Settings page of your Plausible plugin inside WordPress.
It’s smooth as butter and takes less than 30 seconds:
![]()
With this feature, you can track the following custom events automatically:
- Complete Purchase: Records a conversion along with its revenue earned in Plausible whenever a purchase is completed on your WooCommerce store.
- Start Checkout: Records an event whenever someone starts a checkout, regardless of whether they complete it or not (helps with understanding checkout abandonment rates).
- Add to Cart: Records an event whenever someone adds an item to their cart (helps with understanding cart filling and abandonment rates).
- Visit /product*: WooCommerce stores generally have their product pages on the path: `URL/product/example product`. This kind of a pageview goal helps in tracking product views and their related metrics.
- Remove from Cart: Records an event whenever someone removes an item from their cart.
Secondly, you can track the following custom properties automatically.
For context, custom properties are additional contextual information about custom events.
For eg. If “Add to cart” is an event, then “product name” and “quantity” can be its custom properties. This helps build a complete picture of what was added to the cart.
- cart_total
- cart_total_items
- id
- name
- price
- product_id
- product_name
- quantity
- shipping
- subtotal
- subtotal_tax
- tax_class
- total
- total_tax
- variation_id
On top of this, a 4-step ecommerce purchase funnel is created automatically for you. This helps understand the user journey from viewing a product, to adding to cart, to starting checkout and finally to completing a purchase (notice the “Woo purchase funnel” in the gif above?).
This funnel also helps see the drop-off rates between these progressive steps and understand where and what to optimize to maximize sales.
No coding required, one-click event and funnel tracking, and instant access to data. That’s Plausible Analytics for you! Of course, you can set up more events and other things easily as well. Let’s see.
Additional ecommerce site tracking with Plausible
You will find a bunch of more settings on the Settings page of your Plausible Analytics plugin inside WordPress.
Additional features of the plausible plugin for WooCommerce
You can utilize other “Enhanced Measurements” and additional settings, as listed on the Plausible plugin Settings page inside WordPress.
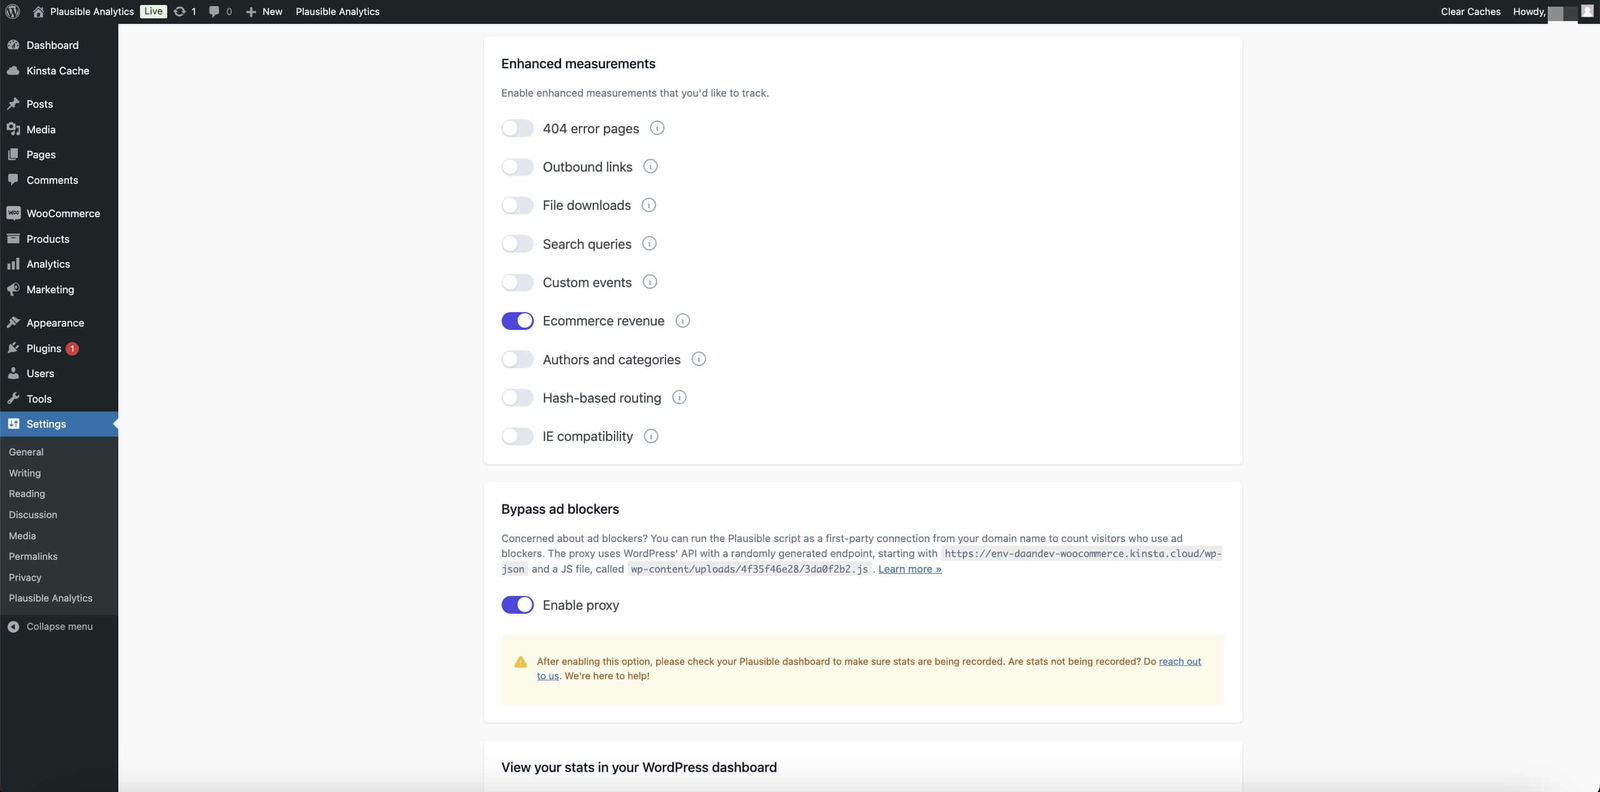
Such examples include tracking site search terms, 404 error pages, outbound clicks, etc. We highly recommend going through our detailed plugin overview here, where we explain each setting and more.
Additional store tracking with your Plausible account
You can track other ecommerce events, pageview goals, properties, funnels, and anything at all for your ecommerce website. If you don’t see a specific plugin setting for your use case in the detailed overview linked above, you can likely track it using your Plausible account.
For eg., if you want to track the clicks to your mobile app download button, it can be done using either of custom event goals or pageview goals in Plausible.
Your Plausible account functions just like any standard account, giving you access to all regular features. For a complete overview and to adjust any necessary settings, check the Plausible Docs. Or, reach out to hello@plausible.io.
Best practices for using Plausible Analytics for WooCommerce
We recommend implementing the following practices, as applicable, to ensure an optimal and highly functional setup.
Tag your URLs with referral sources or UTM tagging, whenever using them in your ads, socials, emails, or anywhere else. This practice will reduce the traffic categorized as Direct/Unknown and provide clearer insights into your traffic sources and channels. This can later be filtered by your revenue-synced goals, revealing your top performing marketing channels.
Connect Plausible with your Google Search Console account to get an overview of the top performing keywords that bring your traffic from Google. This will help you understand how well your content and SEO contribute to traffic, sales and other goals.
Import historical GA4 data, if you are making a switch from a Google Analytics 4 account to a Plausible account for tracking your ecommerce analytics.
Track revenue with money-making goals like completing purchases. Although, this is an automatically implemented goal in Plausible as explained above, if there are other things that bring revenue to you, utilize such revenue-synced goals. For eg., if you conduct exclusive ticketed product reveal events, then you can track the sales of these tickets with revenue goals as well.
Create audience segments by using filtering options in Plausible. This can help answer specific business questions. A few examples: How many buyers came from SEO activities?, or Which of our products are the most popular in Spain?, or Which pages are viewed the most on mobile?, etc. Talking of key business insights, there are multiple ways Plausible can help answer those. Let us see.
Answering key ecommerce questions with Plausible Analytics
Below are some of the most common use cases we have seen for ecommerce site owners, and how Plausible can help address them.
What are my store’s conversion rates and how can I improve them?
Conversion rates—such as purchases, adds-to-cart, and other events—help you understand how many visitors are taking key actions. And therefore, helps with ideas and strategies on optimizing your site for more sales and other conversions.
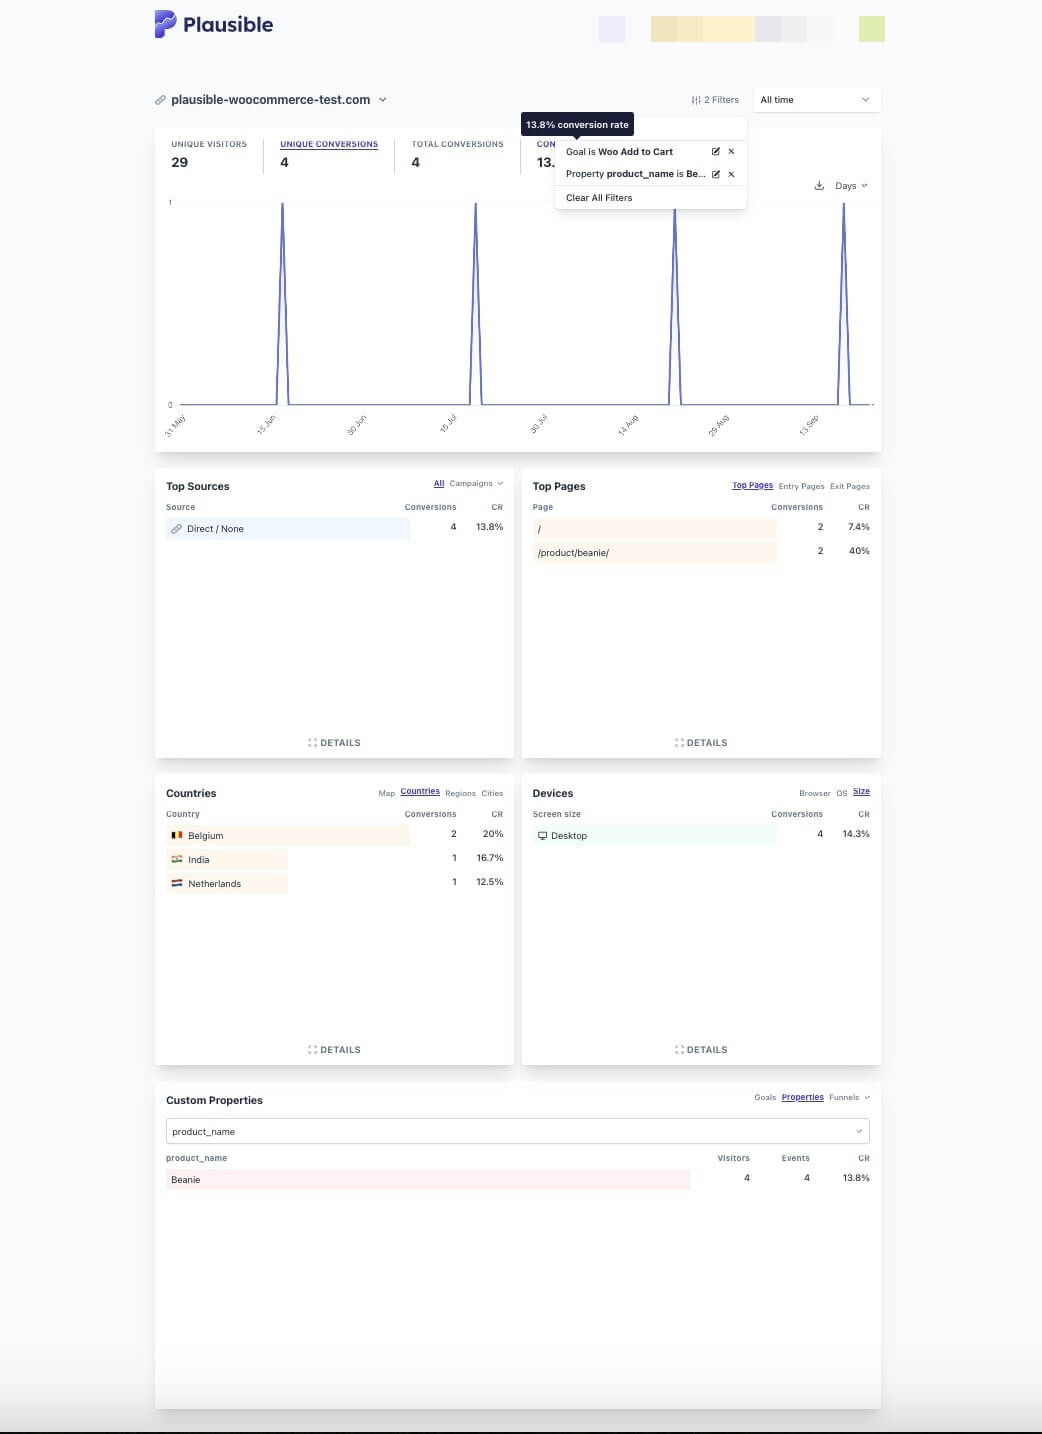
Here’s a simple example. Upon turning on “Ecommerce revenue” enhanced measurement, the goal of “Add to cart” and the property of “product name” are automatically added to the Plausible setup, among other things.
Assume you sell beanies. It will be automatically tracked as a product name property.
So if you had to find out how many of those have been added to cart till date, you could apply two filters on the Plausible dashboard: “Goal is Woo Add to Cart” and “Property product_name is Beanie”.
This shows that 4 out 29 unique visitors (a 13.8% conversion rate) have added beanies to their carts till date.
This data is accompanied by other key information (which also got filtered by sessions in which conversions occurred) such as traffic acquisition sources, top pages visited, countries where conversions took place, devices used, and additional details.
This is also useful in strategic planning. For example, it is seen that Belgium, India, and the Netherlands showed interest in beanies. So you could experiment with advertising campaigns for these countries.
Or that all of the traffic is received on the desktop version, so a mobile site or mobile app may not be a priority for the business right now.
Pro tip: These insights can be further broken down, by clicking the “Details” option.
Which marketing channels are driving the most sales?
Knowing which marketing efforts are paying off helps with optimizing ad spend and other marketing campaigns. Plausible automatically tracks the performance of various marketing channels, like social media, email, paid ads, organic search, referring site, etc.
This is possible as Plausible automatically takes the referral tag from links that bring you traffic. But if you tag URLs with UTM parameters, you can further break down your traffic sources by UTM campaigns, terms, etc., and monitor the conversion rate for each channel.
This data is available in your “Top Sources” report and clicking on any entry of that report filters your entire dashboard by that traffic acquisition channel.
This allows you to:
- Understand which channels are driving the most traffic and revenue.
- Analyze which marketing efforts result in repeat purchases vs. attracting new customers.
With this, you can make data-driven decisions on where to focus your marketing budget, scaling the channels that bring in the most profitable traffic and cutting those that underperform.
How can I minimize cart abandonment?
Cart abandonment is a common challenge for online stores. Plausible’s built-in event tracking helps you monitor where users abandon the cart and helps in analyzing potential reasons.
Using the Start Checkout and Add to Cart events, you can analyze:
- At which point in the checkout process users are abandoning their cart (e.g., after shipping costs are displayed).
- Which products are most frequently abandoned, helping you spot potential pricing or product page issues.
This data can help you test various solutions like offering free shipping, simplifying the checkout process, or adding reminders for abandoned carts to win back potential customers.
What are my store’s engagement levels?
Beyond product-specific tracking, you need a high-level view of how your entire ecommerce site is performing. Plausible gives you clear, real-time insights into:
- Total traffic and page views, including which pages drive the most engagement.
- Average time on site and bounce rates, showing how well your content is resonating with visitors.
- Geographical location of visitors, allowing you to refine location-based promotional offers.
These metrics help you understand not just how many people are visiting your store, but how they are interacting with your content. If certain pages have high bounce rates or low time on site, you can focus on improving those areas to keep visitors engaged.
How can I manage my refund and return rates?
Refunds and returns can significantly impact your bottom line, so it’s important to keep them in check. By adding a custom event for return and refund requests, you can monitor refund rates by product to see if certain items are being returned more often than others.
By identifying such patterns, you can address potential issues with product descriptions, images, or quality, helping to reduce your return rates over time.
Quick recap
Plausible Analytics offers WooCommerce store owners an easy, one-click setup for tracking key ecommerce metrics such as sales, conversions, cart abandonment, marketing performance, and other key insights.
Unlike Google Analytics, Plausible is super simple to set up and use, is GDPR-compliant, and provides accurate, privacy-friendly insights without slowing down your site.
With built-in ecommerce event tracking and an intuitive dashboard, Plausible helps you optimize customer journeys, improve product performance, and scale your marketing efforts — all in just a few clicks.
You could have your ecommerce funnel ready in the next 10 minutes. Try the Plausible for WordPress plugin for free.