Hostname or subdomain tracking
Does your site operate on a single domain name with multiple subdomains such as docs.yourdomain.com, app.yourdomain.com and www.yourdomain.com?
Plausible helps you simplify cross-subdomain tracking. You can view the visitor journey end-to-end from the landing on your primary domain name to a conversion on the subdomain. The original referral source will stay attributed to that visitor even when the visitor moves from one of your subdomains to another.
Here's how to track the user journey across your domain name and its subdomains.
How to track the user journey across domain and subdomains
-
Add your domain name (
yourdomain.com) as a site to your Plausible account -
We'll provide you with the tracking snippet that you need to insert into your site to start counting the stats
-
Insert that same tracking snippet on both the main domain name and all of its subdomains. This keeps the visitor session active between your primary site and its subdomains
-
Set up custom events or pageview goals for the actions you want to track. You can even follow the user journey in a funnel. Any conversions that happen on your subdomains will be attributed to the original referral source that brought the visitor to your main domain. There's no need to filter out internal referral sources as this eliminates the issue where you might see your subdomains as a major source of traffic
-
Click on any specific referral source in your dashboard to see the number of conversions and the conversion rate (CR) of that referral source for any of your goal completions regardless of the hostname. Or click on any goal in your dashboard to see the number of conversions and the CR of that specific goal for any referral source or landing page
Filtering traffic by hostname
You can also filter your dashboard by hostname. Your dashboard will show all traffic across all your domains by default but filtering by a subdomain allows you to segment your traffic and view stats from a specific subdomain only.
Filtering by hostname comes in handy also if you have pages with identical page paths on different sites (say yourdomain.com/best-page/ and docs.yourdomain.com/best-page/). These identical page paths will be listed under one entry (/best-page/) in the "Top Pages" report on your global dashboard with the stats combined into that one entry. When filtering by hostname, you can see the number of visitors and pageviews on yourdomain.com/best-page/ separately from the number of visitors and pageviews on docs.yourdomain.com/best-page/.
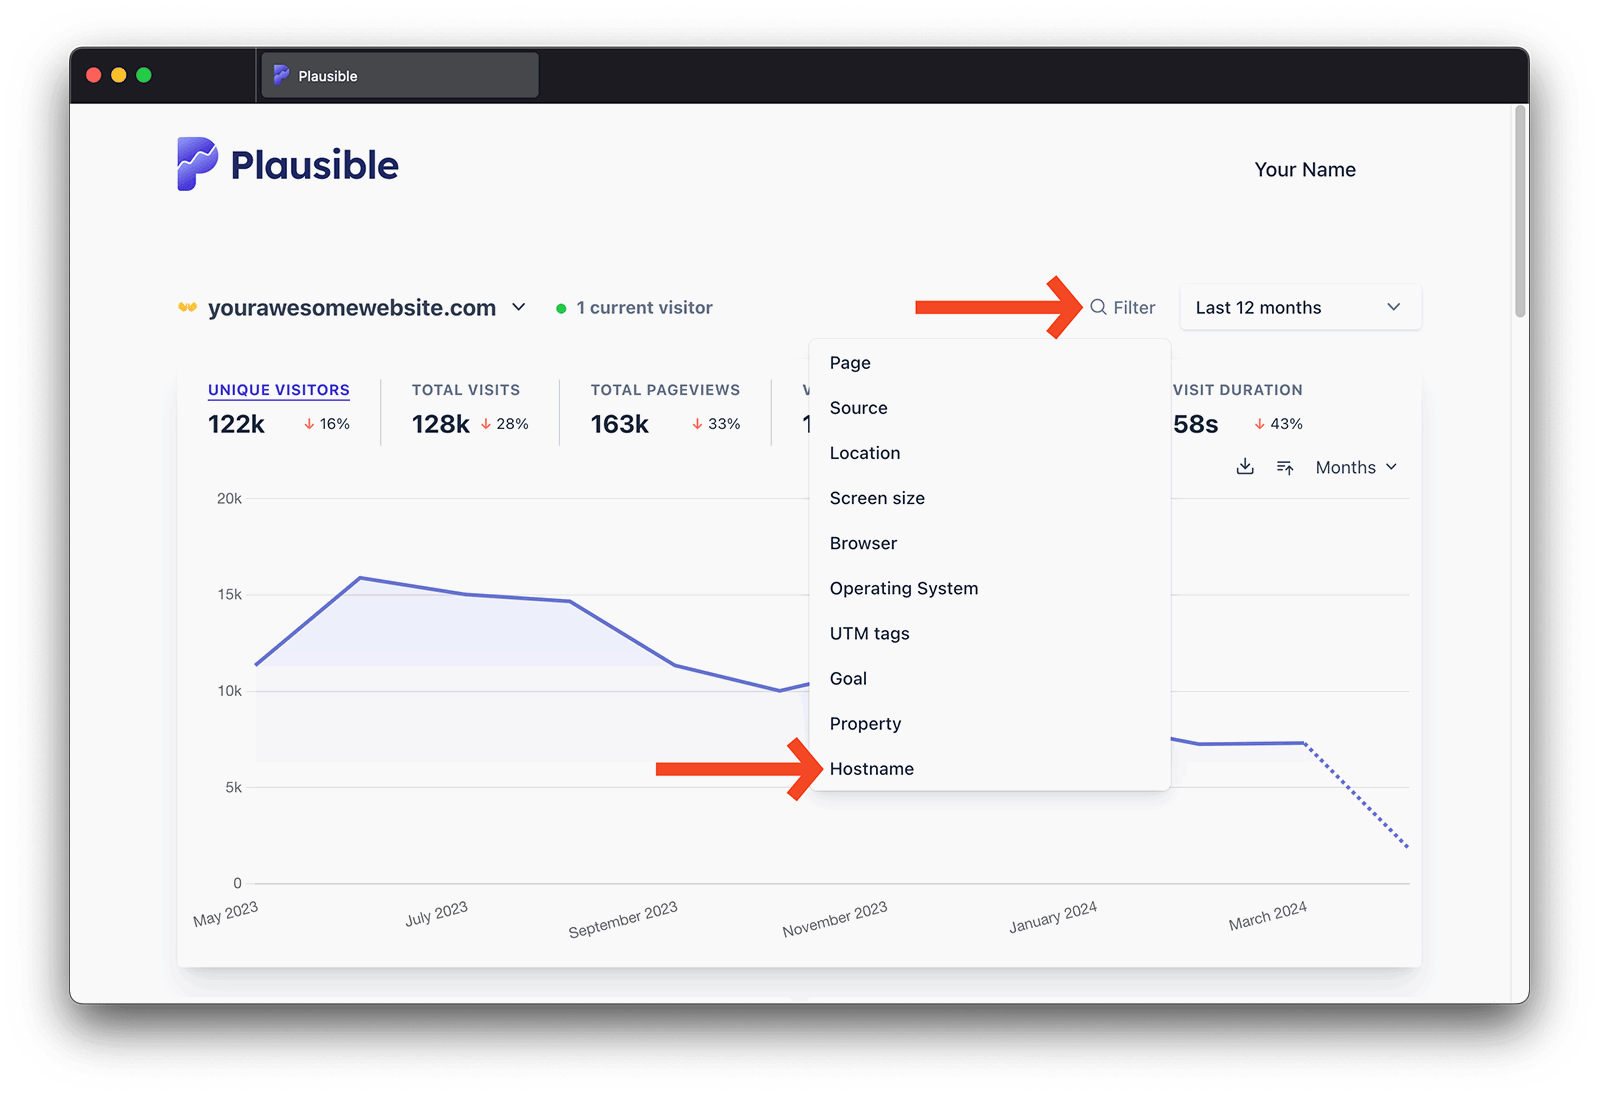
To filter by hostname, click on the "Filter" button in the top-right of your dashboard and choose the "Hostname" entry within the menu.

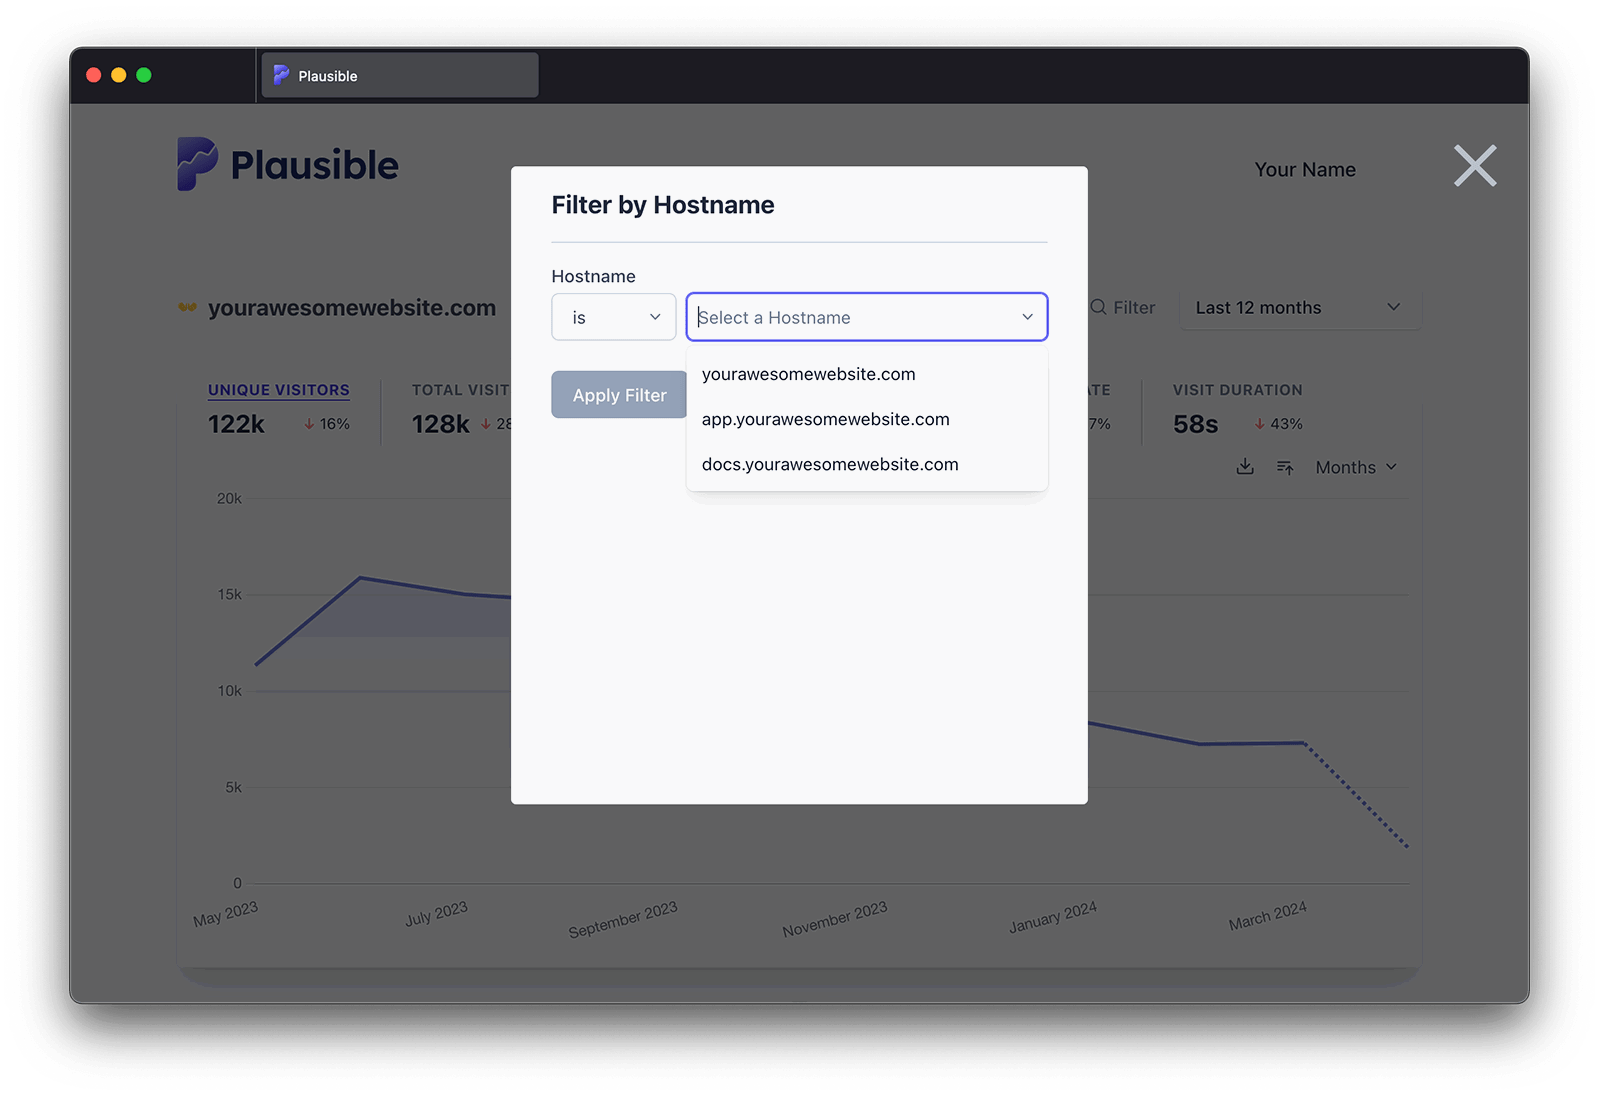
We'll show you the list of all the hostnames we have recorded in the chosen time range:
- You can filter your traffic by one or more specific hostnames from the list ("is")
- You can exclude the traffic from one or multiple hostnames (is not)
- You can segment by all hostnames that contain any particular word (contains)

You can do this by using the filter button or by setting up a pageview goal. See how here
Block traffic from unwanted hostnames
In some cases you may see unwanted or unexpected hostnames in your hostname list. These hostnames vary based on your traffic and on how you've built your site:
-
One of the most common cases of unexpected hostnames would be a web translator or a similar service that proxies your site and modifies its content before it reaches the visitor. For instance,
translate.googis the hostname for visitors who view your content using Google Translate andwebcache.googleusercontent.comis the hostname of visitors who view your site using the cache feature in Google's search results. -
On the other hand, if you’re using Netlify or a similar service to build your site, you may see
deploy-preview.netlify.appor similar hostnames which are the deployments that allow you to preview changes to your site before making them live to the public.
From our side, we detect and block bot traffic out of the box. We filter out known referrer spam domains, we block traffic originating from data centers, and we detect and exclude unnatural traffic patterns.
And our script automatically disables itself when running on localhost to reduce the recording of traffic from testing environments.
There are also some things you can do from your side to block traffic from unwanted hostnames:
Exclude internal traffic
You can exclude your internal traffic by IP address from being recorded in the dashboard.
Allow traffic from specific hostnames only
If you prefer to only record traffic from specific hostnames (and block all the other traffic), you can do so in your site settings:
- Visit the site settings area for the dashboard in question
- Choose "Hostnames" in the "Shields" entry in the left-hand menu
- Then click on the "Add Hostname" button to add a new hostname to your allow list
You can group your hostnames when adding them to the allow list:
*.yourdomain.comwill record all traffic on all subdomains ofyourdomain.combut won't record traffic ofyourdomain.comitself*yourdomain.comwill record all traffic on all subdomains ofyourdomain.comandyourdomain.comtraffic itself will be recorded too
Once added to the allow list, we will start blocking traffic from all the other hostnames within a few minutes. You can add up to 30 different hostnames.
You can see the list of all the hostnames that you're allowing the traffic from at any time. Click on the "Remove" button next to a hostname to remove it from the allow list.
When to add a subdomain as a dedicated site
If you don't want to track visitors of a specific subdomain together with those of your other sites in the same dashboard, you should add that subdomain as a separate site to your Plausible account.
For example, if your subdomain is https://blog.yourdomain.com then the part to enter in the "Domain" field when adding a new site is blog.yourdomain.com. This would give you one dedicated and standalone dashboard for that particular subdomain.